On the Performance tab, you will find all the necessary details related to model performance. This section is typically used for getting an overview of performance data and sharing it with concerned stakeholders.
Note that the performance is also continuously monitored through the Monitors tab and can be analyzed in greater detail there.
Types of interactive visuals available here include:
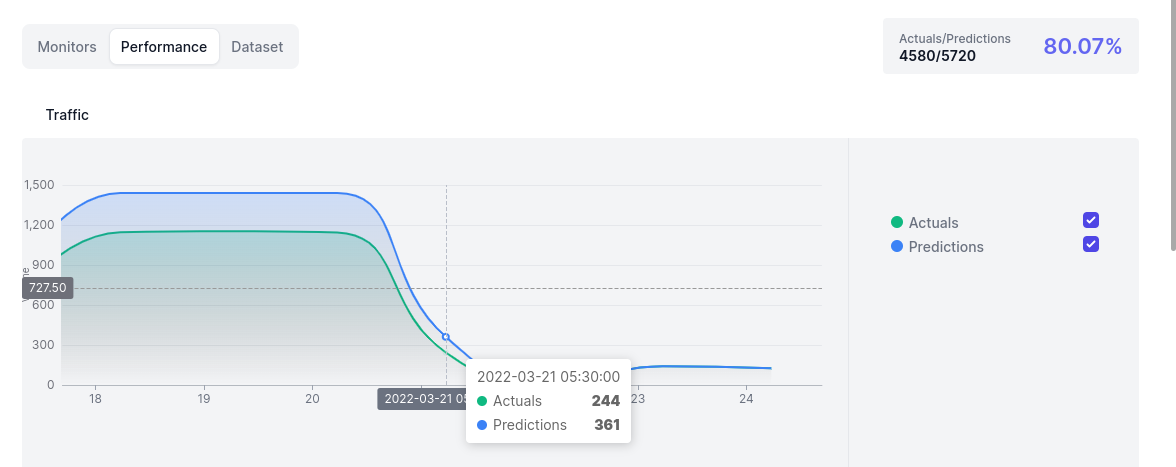
- Traffic vs. Timeline graph for viewing or comparing the volume of actuals and predictions
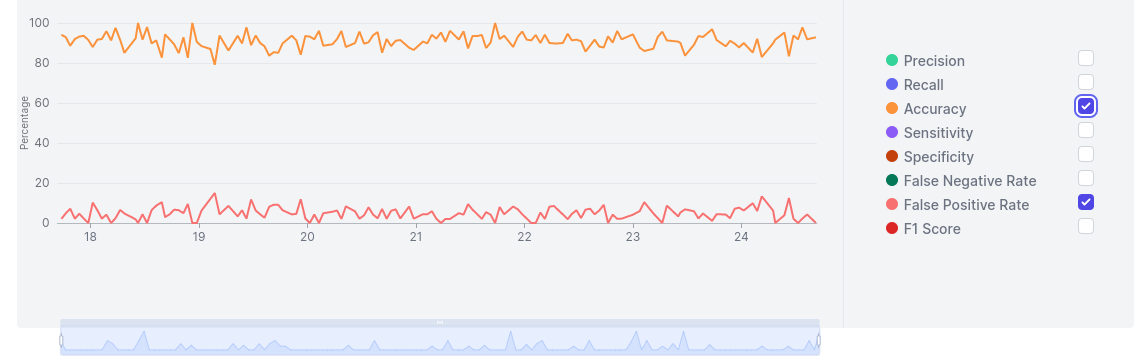
- Line-graphs for viewing or comparing performance metrics.