The Censius Console is a seamless UI experience that lets you add, organize, and customize unlimited monitors with just a few clicks.
Being an intuitive platform, the UI is user-friendly and requires minimal guidance to get started. However, the following will help you build a good mental model to grasp and organize everything.
📁 Projects
The first screen you will see on logging in is Projects.
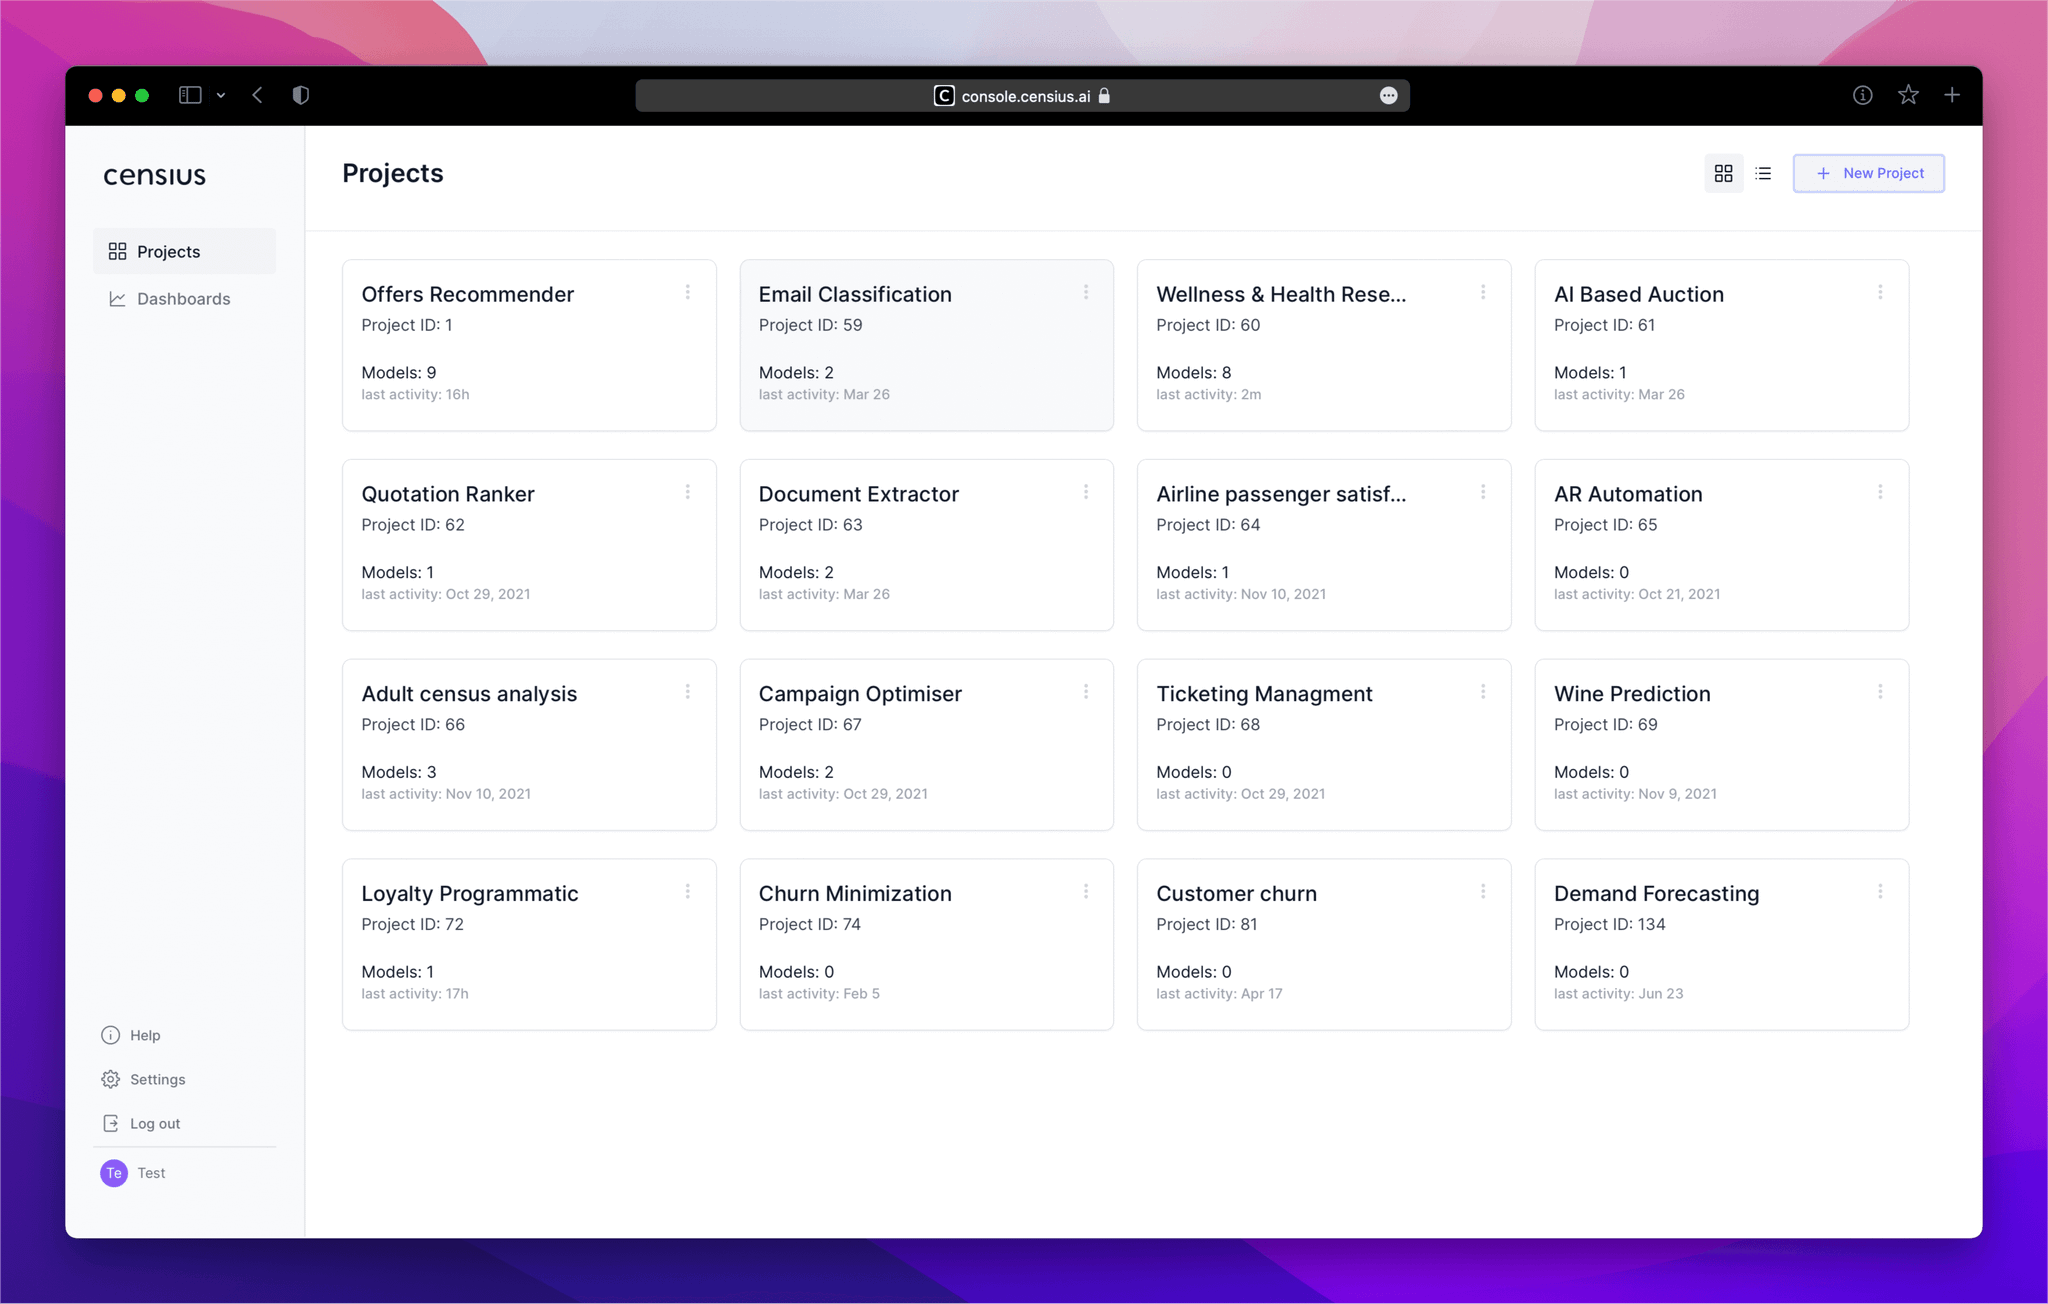
Projects is where you can manage and get a high-level view of all the projects you have plugged into Censius. Details available include:
- Project Name
- Project ID
- Number of models in the project
- Last activity status
- Violation indicators
On clicking a Project, you will get access to all the models and datasets associated with that particular project.
🗃️ Models
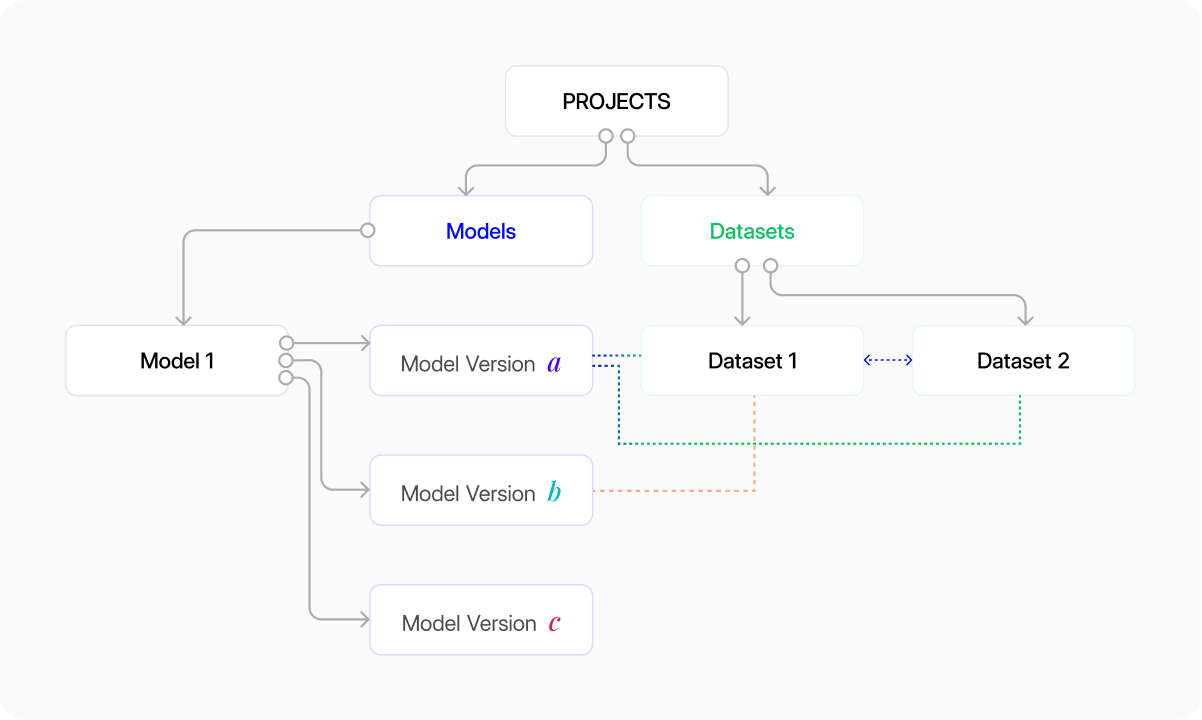
Every project can have multiple models, and each model often ends up having multiple versions.
Censius helps you to organize your models and versions through a simple and clean UI, so you can instantly jump into the issues without worrying about administrative tasks such as organizing, filing, or managing controls.
The Models tab displays the following details:
- Model name
- Model ID
- Model type
- Model versions
- Associated datasets
- Creation date
- Violation indicators
🗂️ Model Versions
Model Versions are different instances of a model created whenever the model is trained with a new feature set. It is important to note that new model versions are not created when the model weights change during training.
The model versions for a model are visible on the right panel in the Models tab when the model of choice is clicked. Each model version can be linked to a dataset that is part of the project.
If a model is just retrained on production data, it’s still part of the same model version and can be recorded using the
update_model() API call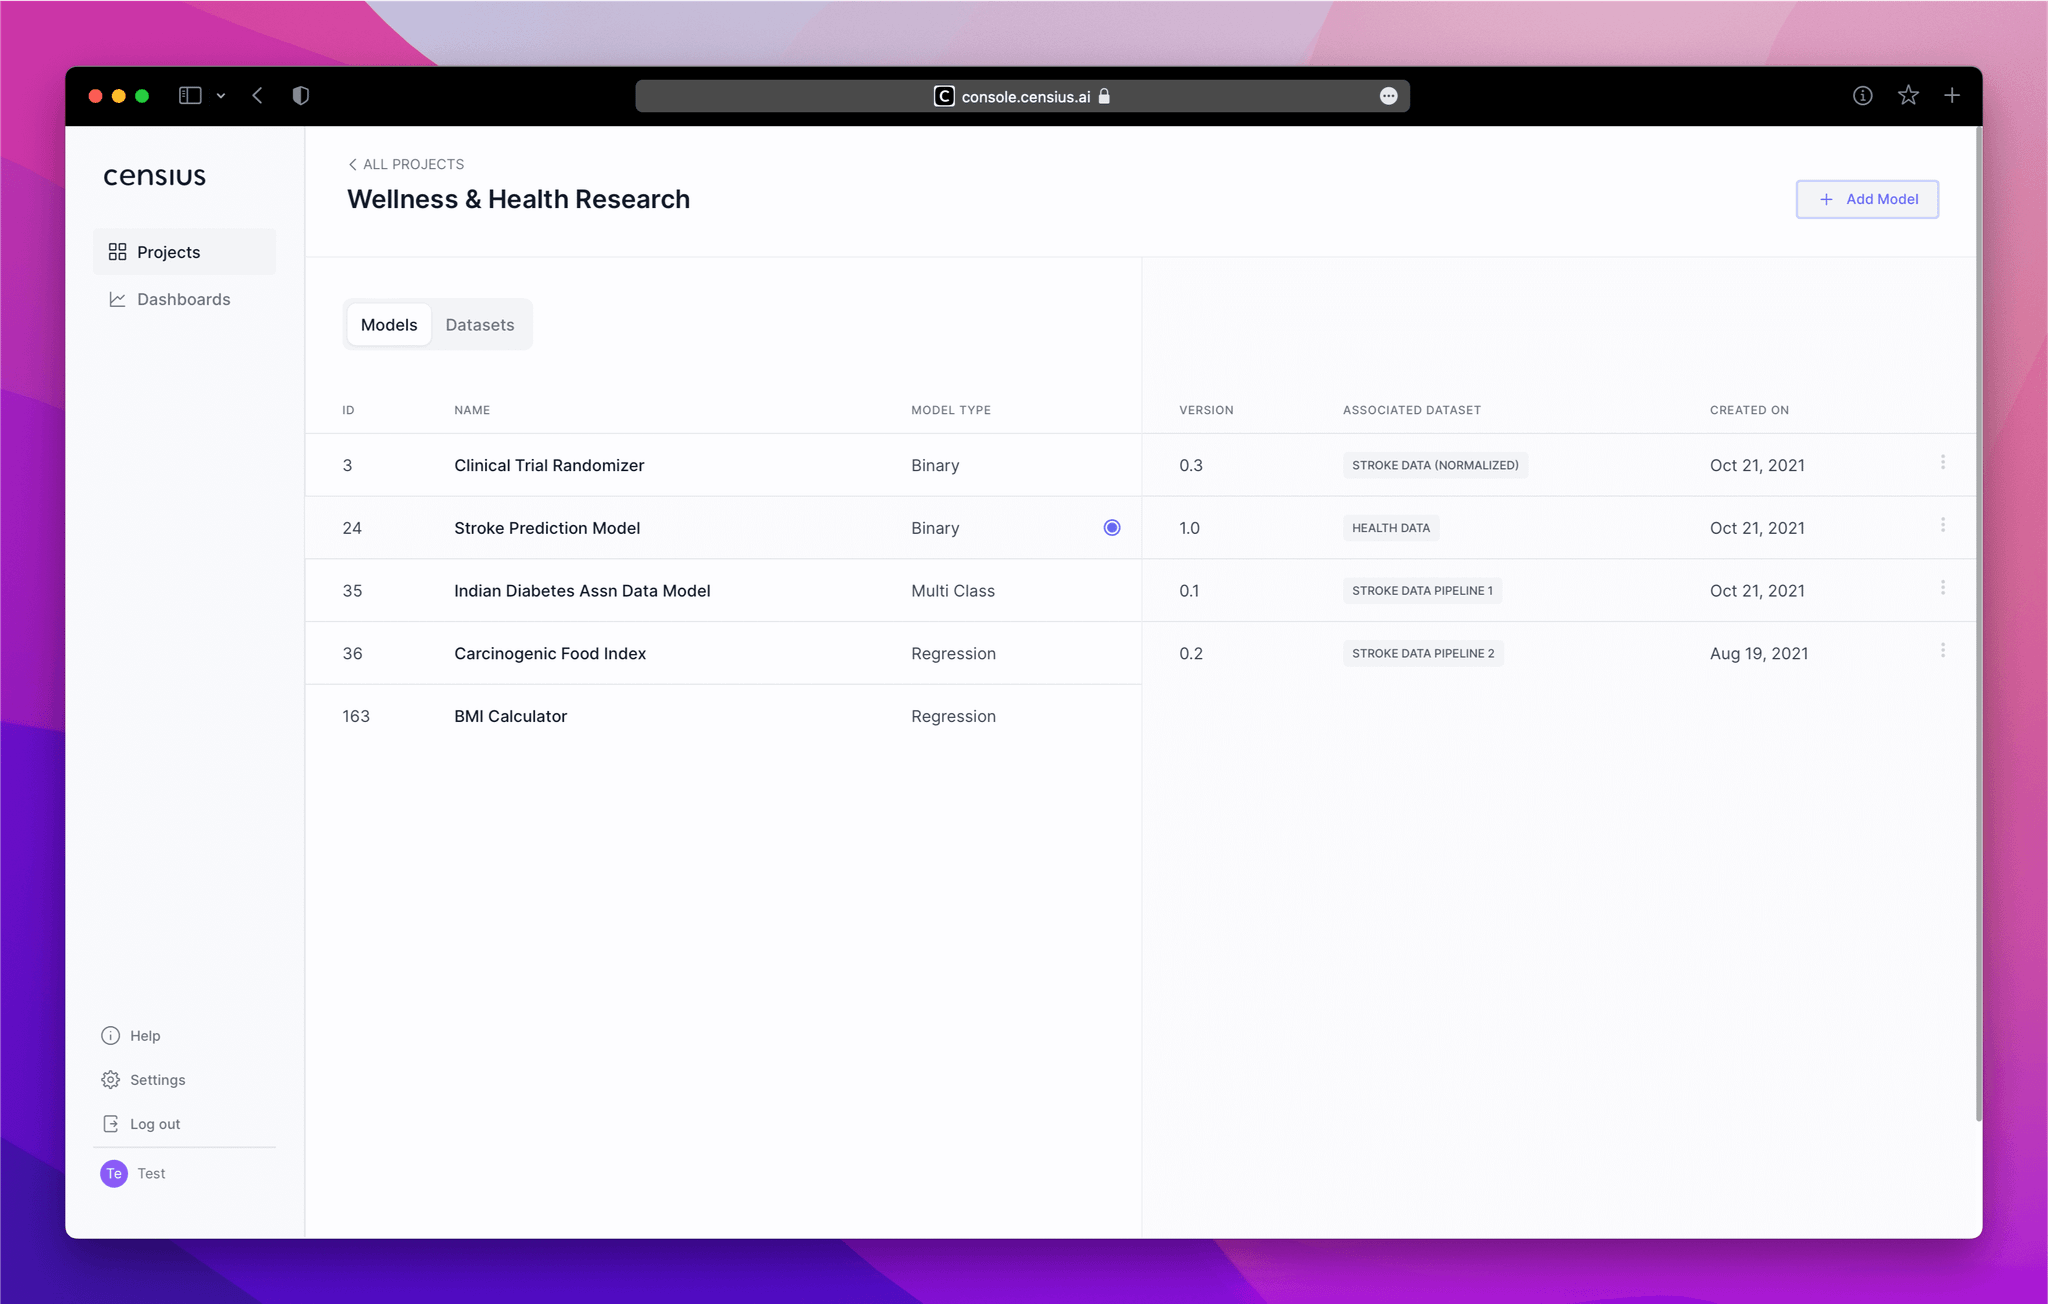
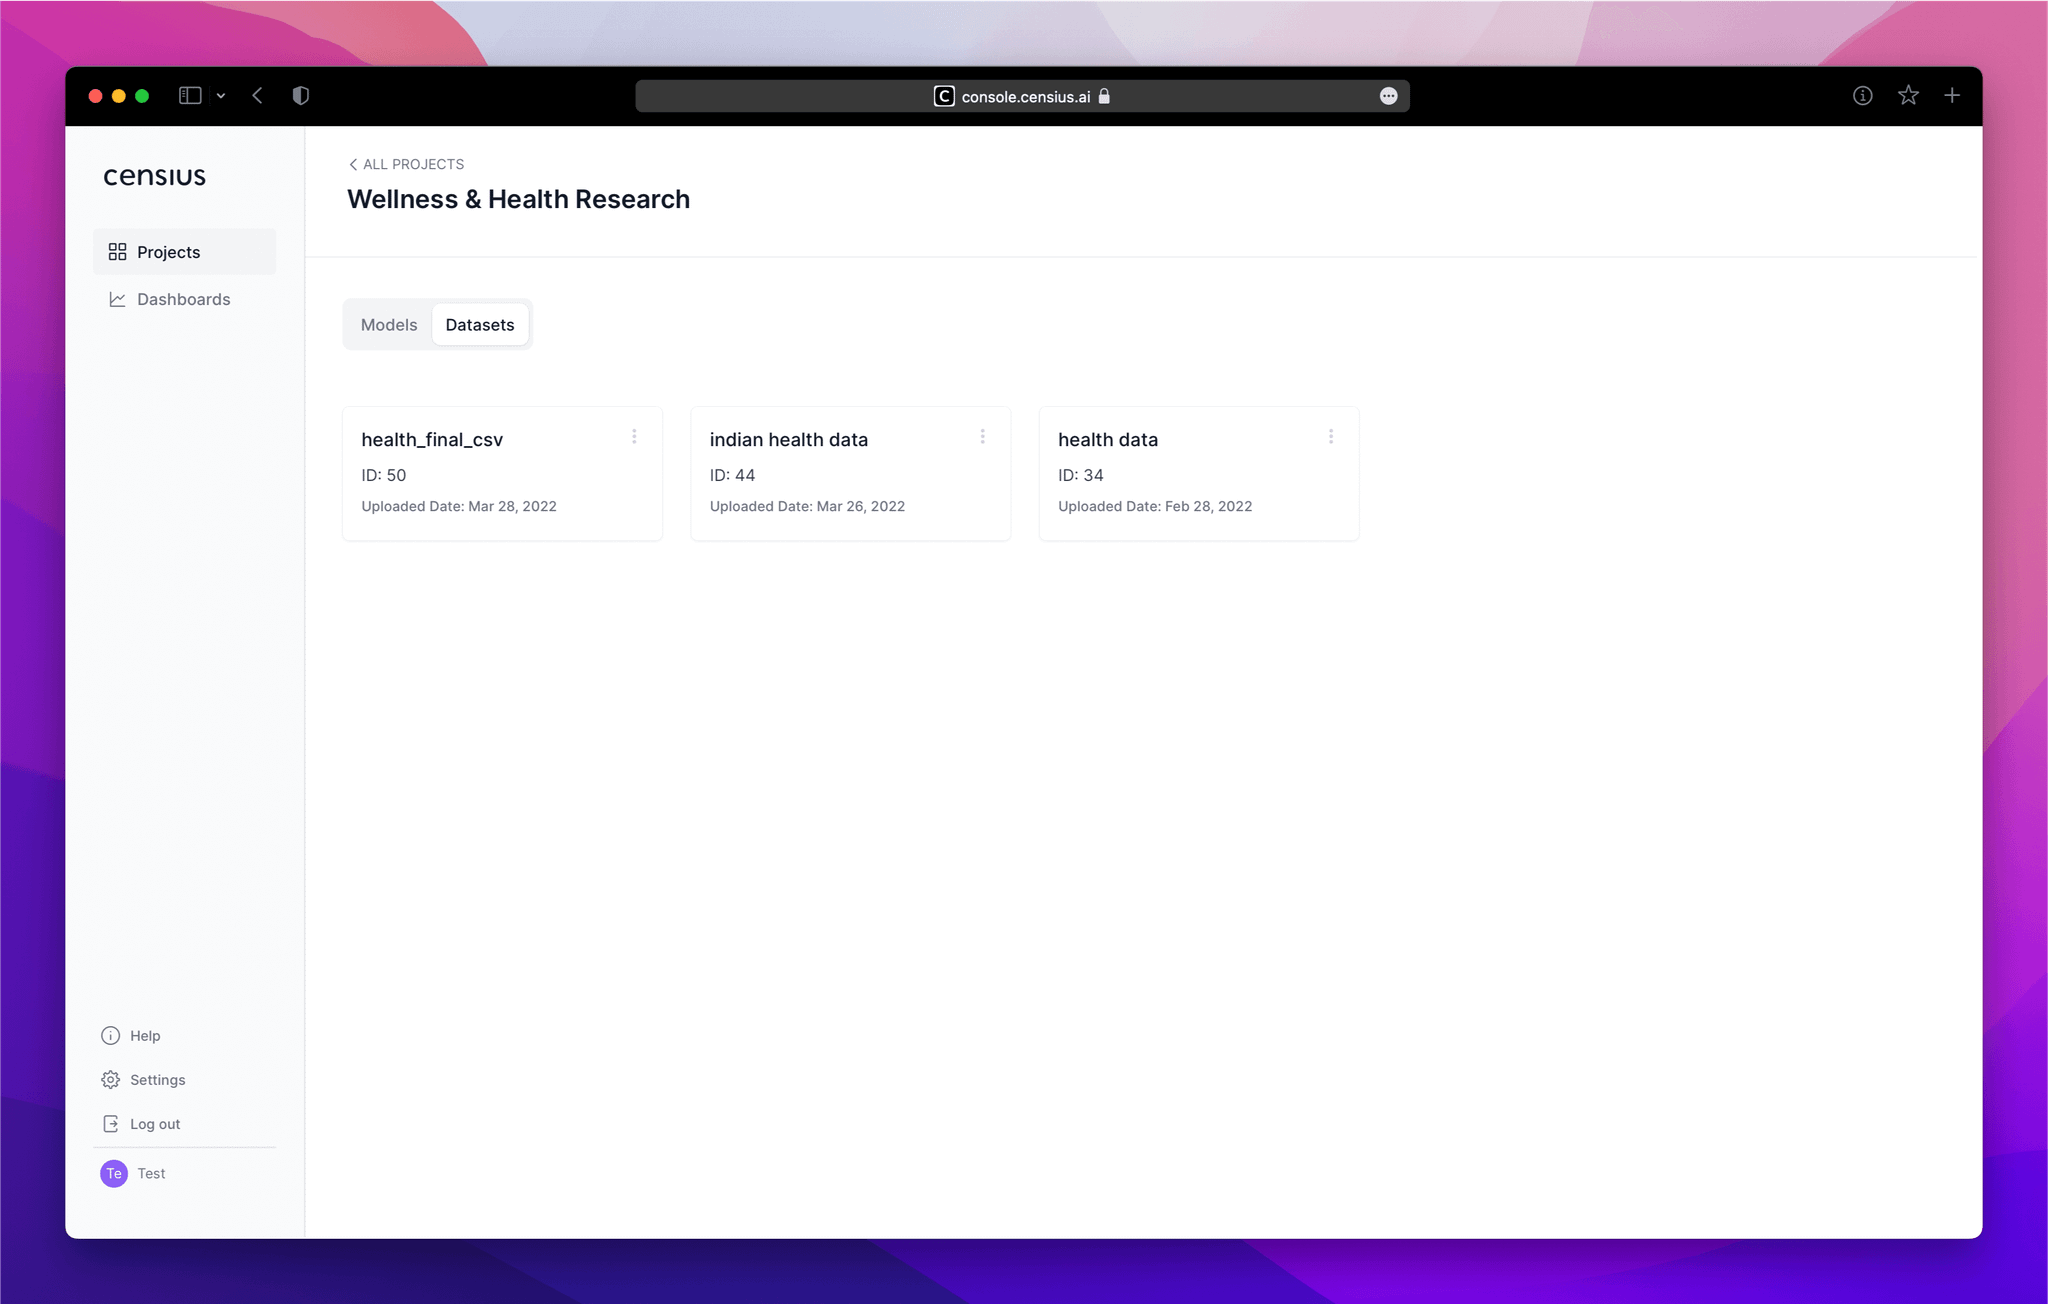
📄 Datasets
The Datasets tab displays all the datasets that the model in the project is or will be linked to. It displays the following high-level details:
- Dataset name
- Dataset ID
- Training/testing/validation status
- Upload date
- Violation indicators
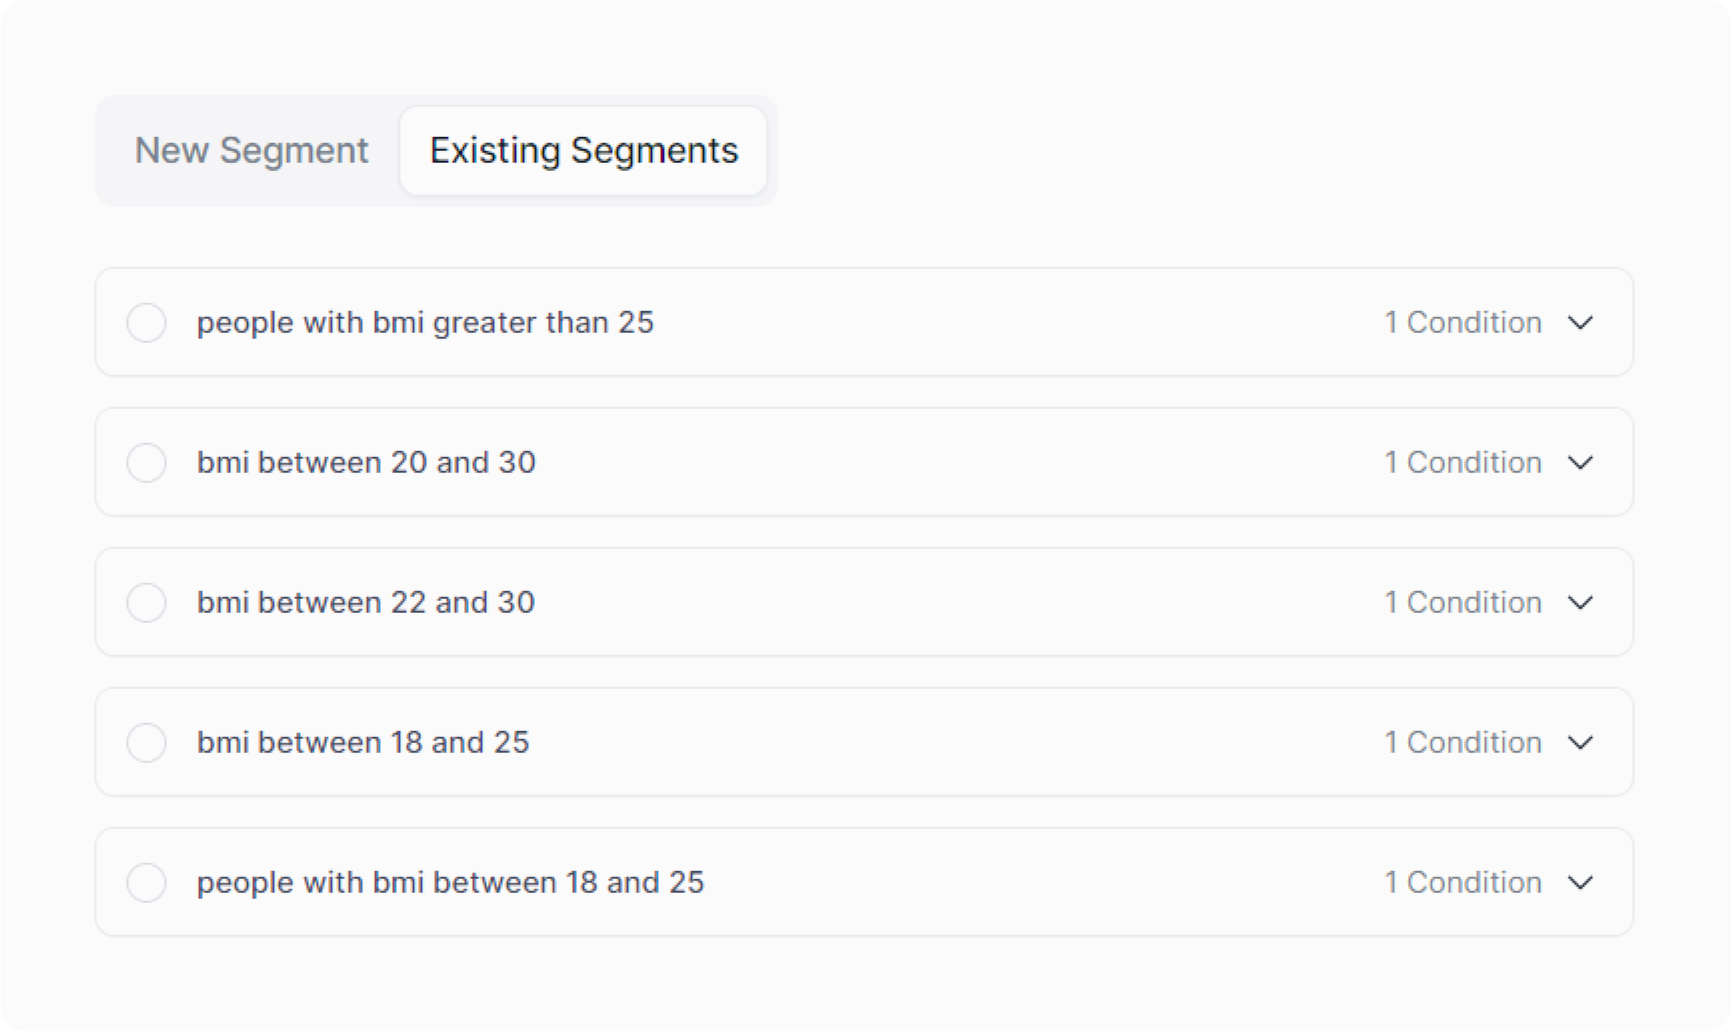
🧮 Data Segments
Data segments are slices of data that are defined by specific conditions. Data is often segmented to ensure that the model results are more transparent for better explainability and post-production analysis and also to closely monitor sensitive data segments.
A few examples of sensitive data segments will illustrate the concept better:
💳 Credit transactions after midnight: Used for models in the banking sector
💉 Patients above the age of 70: Used for models in the healthcare sector
🏗️ Machinery with expired warranty: Used for models in the manufacturing sector
