
The Add Monitor interface is similar to the Editing interface. You only need three steps to launch a monitor:
- Create Monitor
- Configure Monitor
- Set Alerts
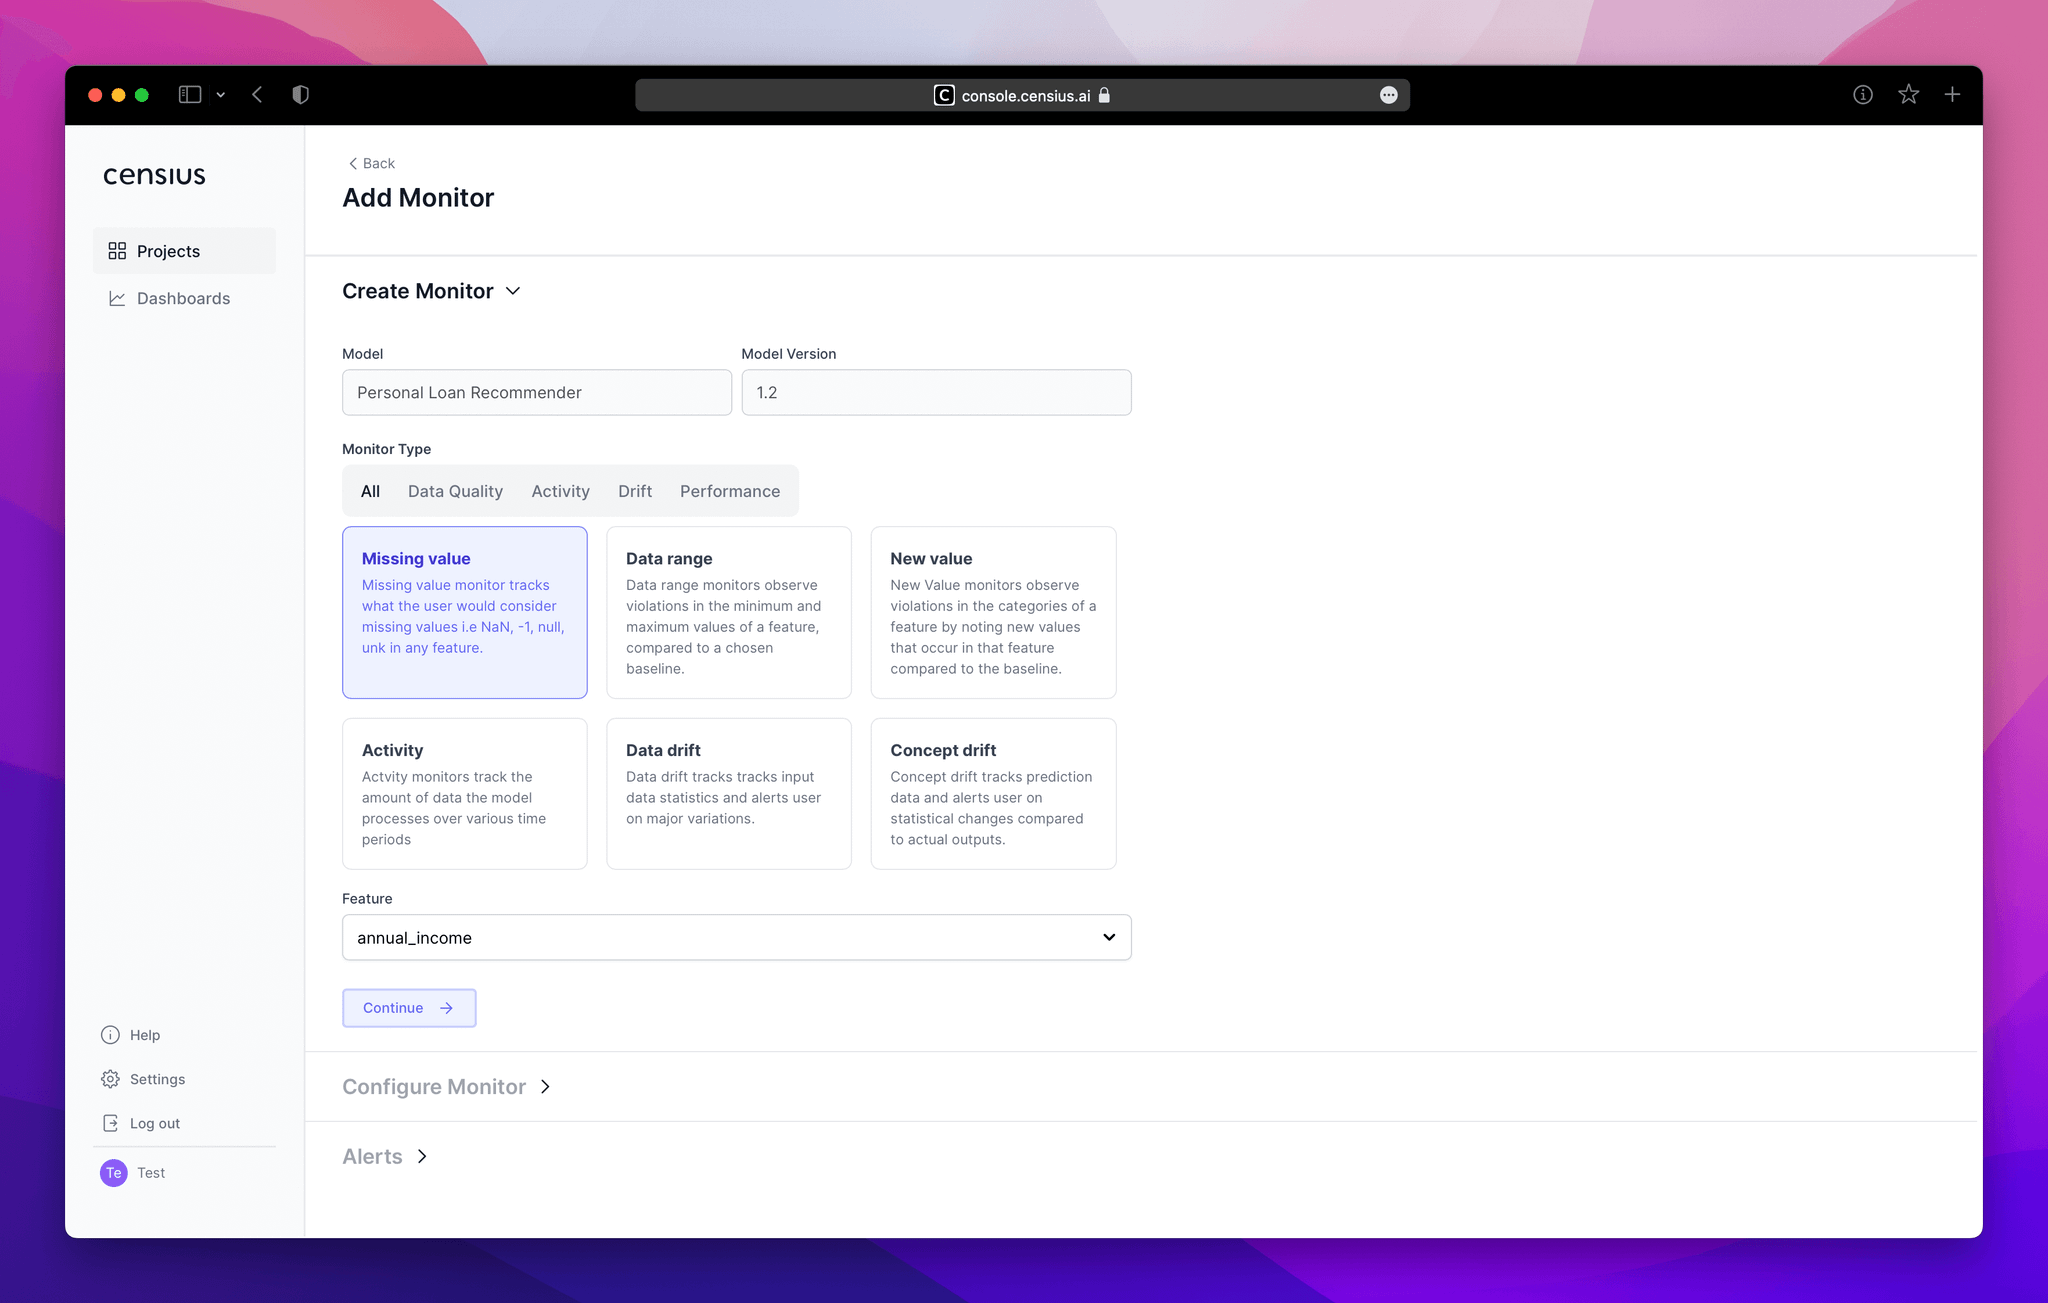
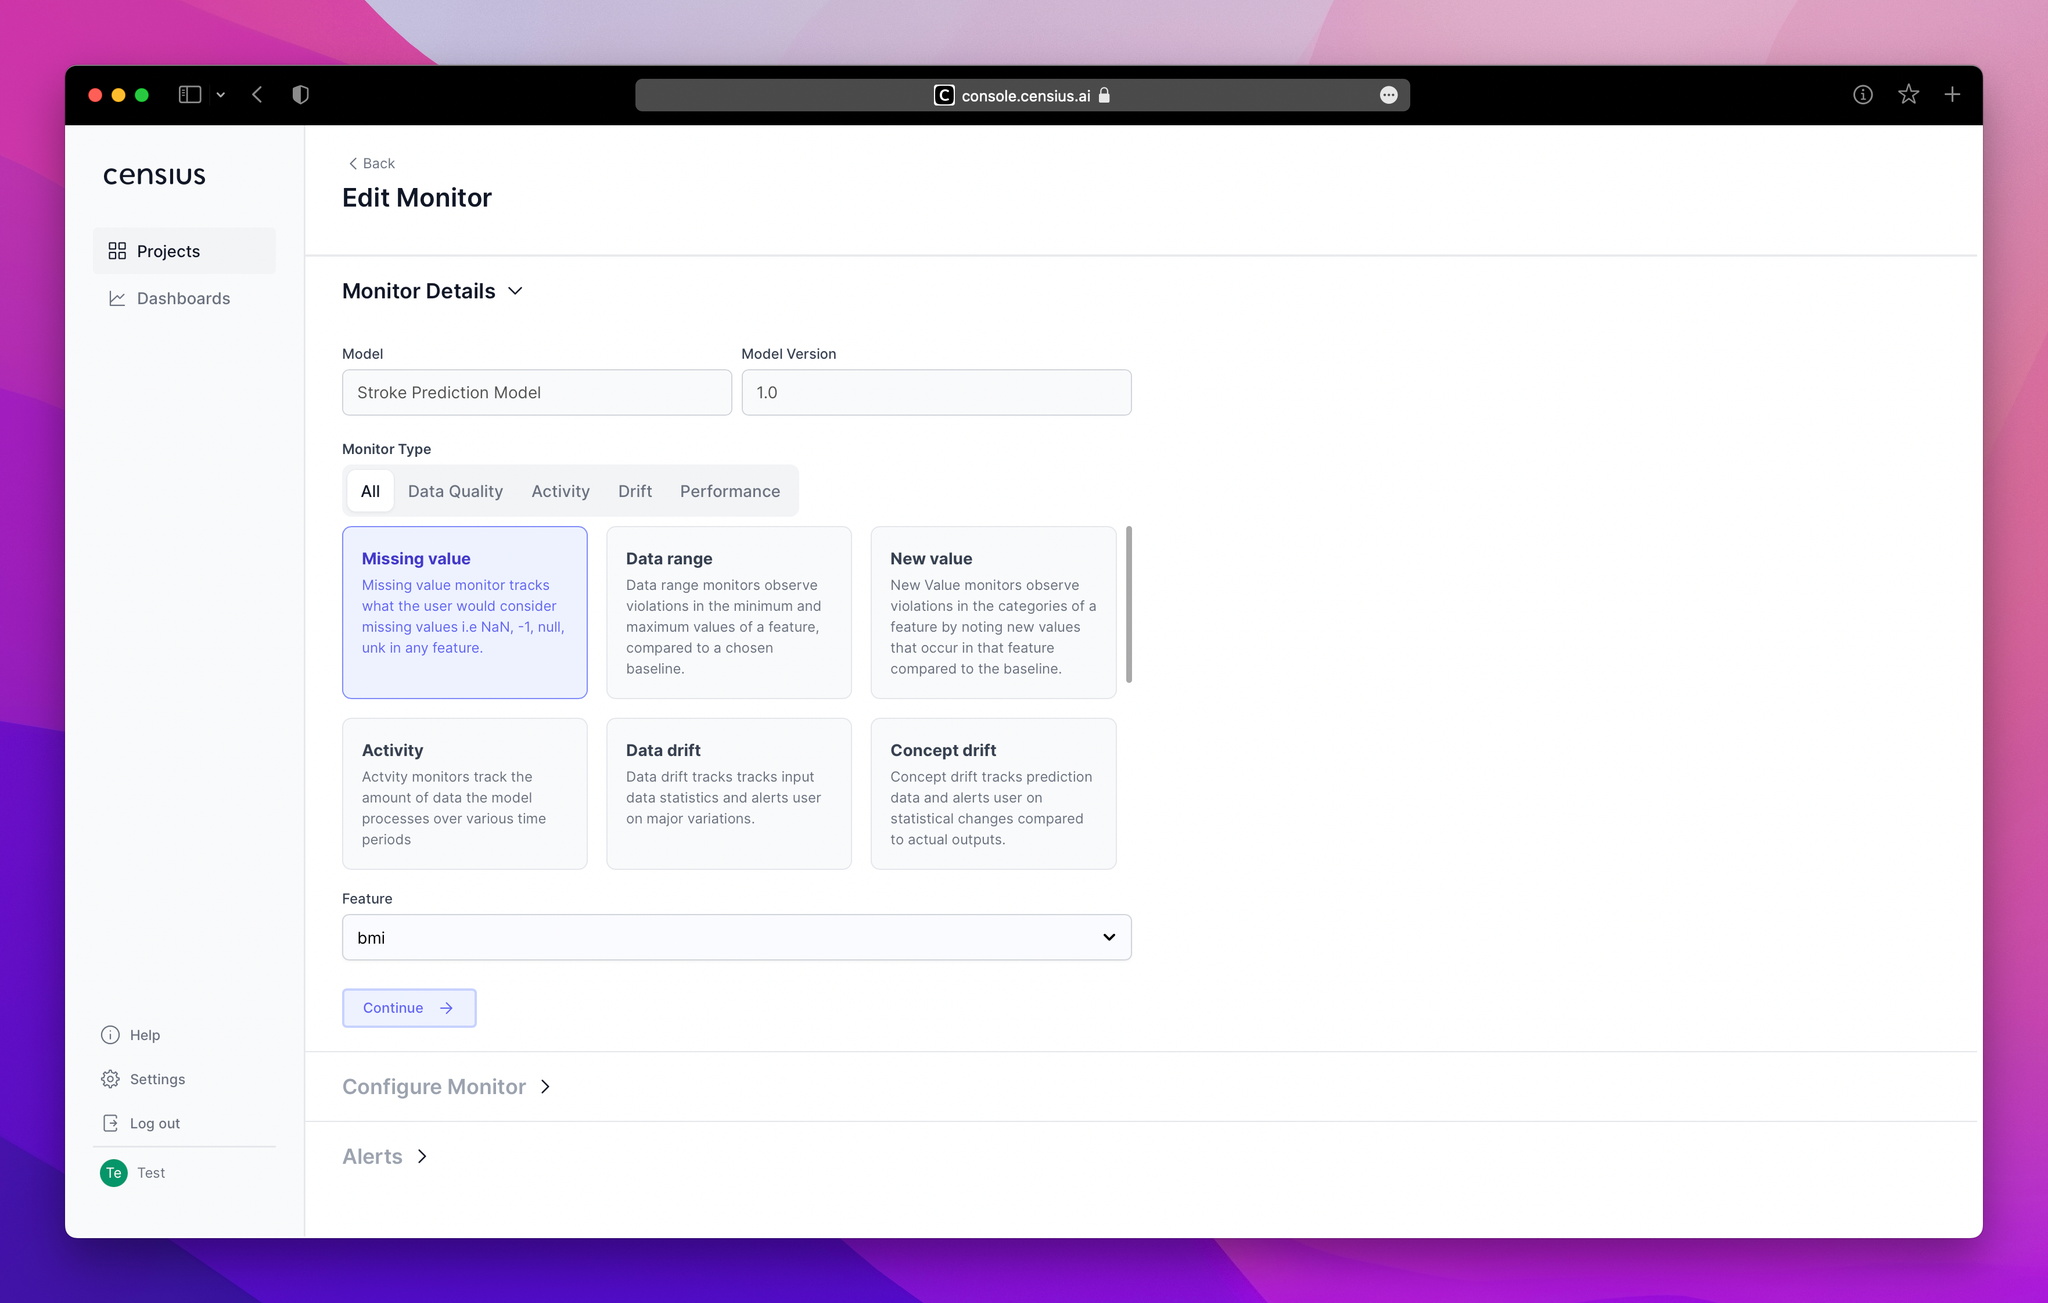
🏗️ Create Monitor
This screen will show an overview of all the available monitors and features that you can choose from. Under Monitor Type you can access performance monitors, data quality monitors, and drift monitors.
To create a monitor:
- Select the required monitor type and the specific monitor under that type
- Select the feature you want to monitor
- Click Continue
🧩 Configure Monitor
Through this section, you can set up or edit various monitors across all the features in the selected model version. Through this screen, you can easily customize the data segment you wish to monitor.
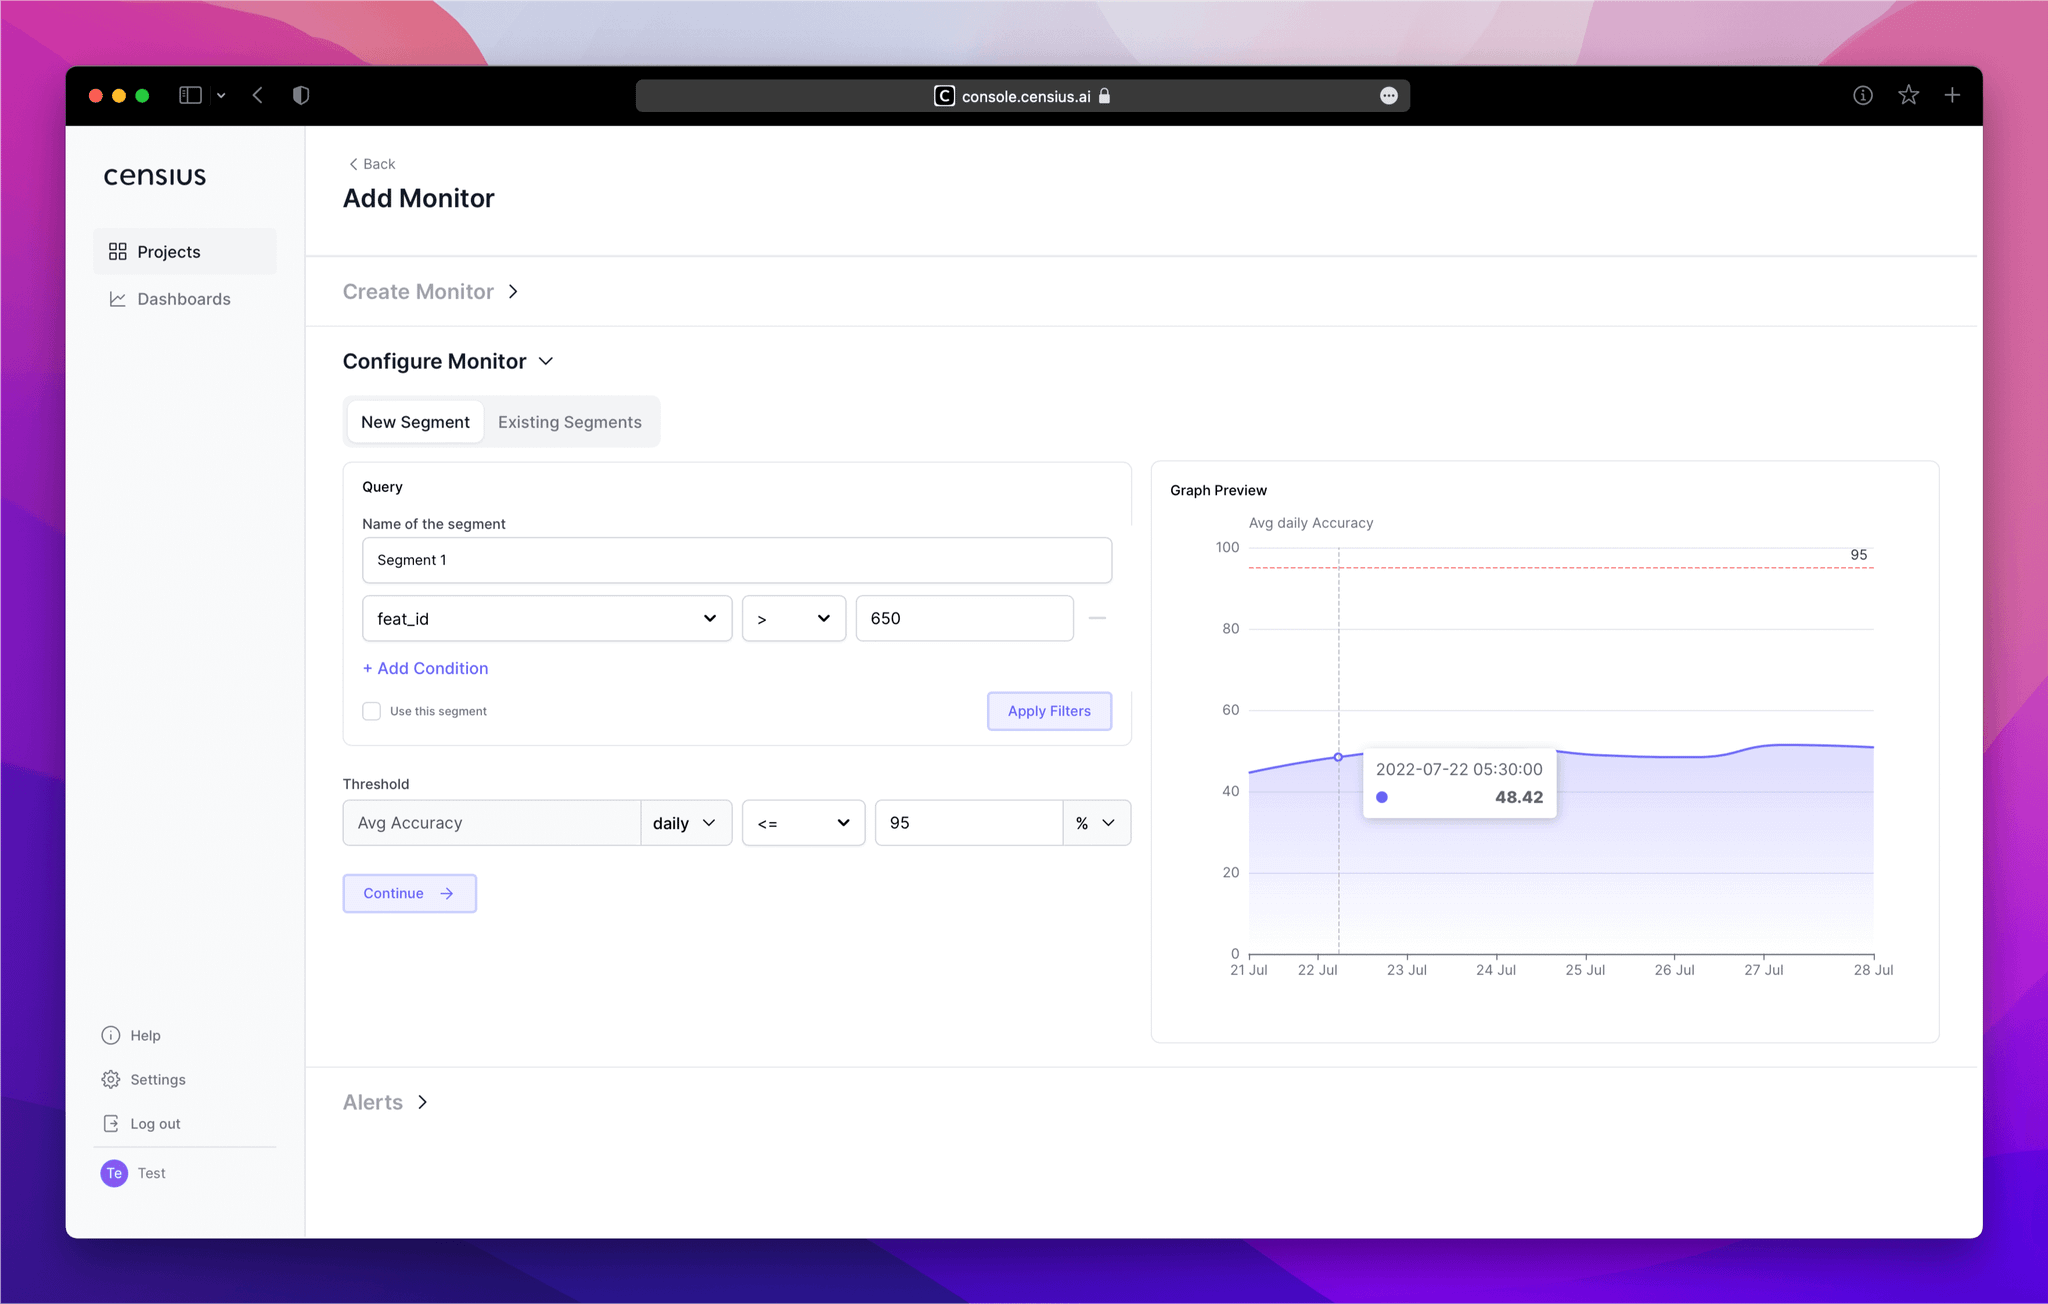
Based on the customizations, an interactive line graph on the right panel will help you to get a visual overview of the data segment. More details such as violations and metric scores can be seen by hovering over the graph.
A data segment is a selected range of data that aggregates mask outliers and enables the user to visualize and detect potential causes. An existing data segment is available on a project level and not across projects
To configure the monitor:
- Create a new data segment or select an existing one
- Select the feature(s) to configure the values for segment boundaries. You can add multiple features and multiple conditions for each feature through the +Add Condition button
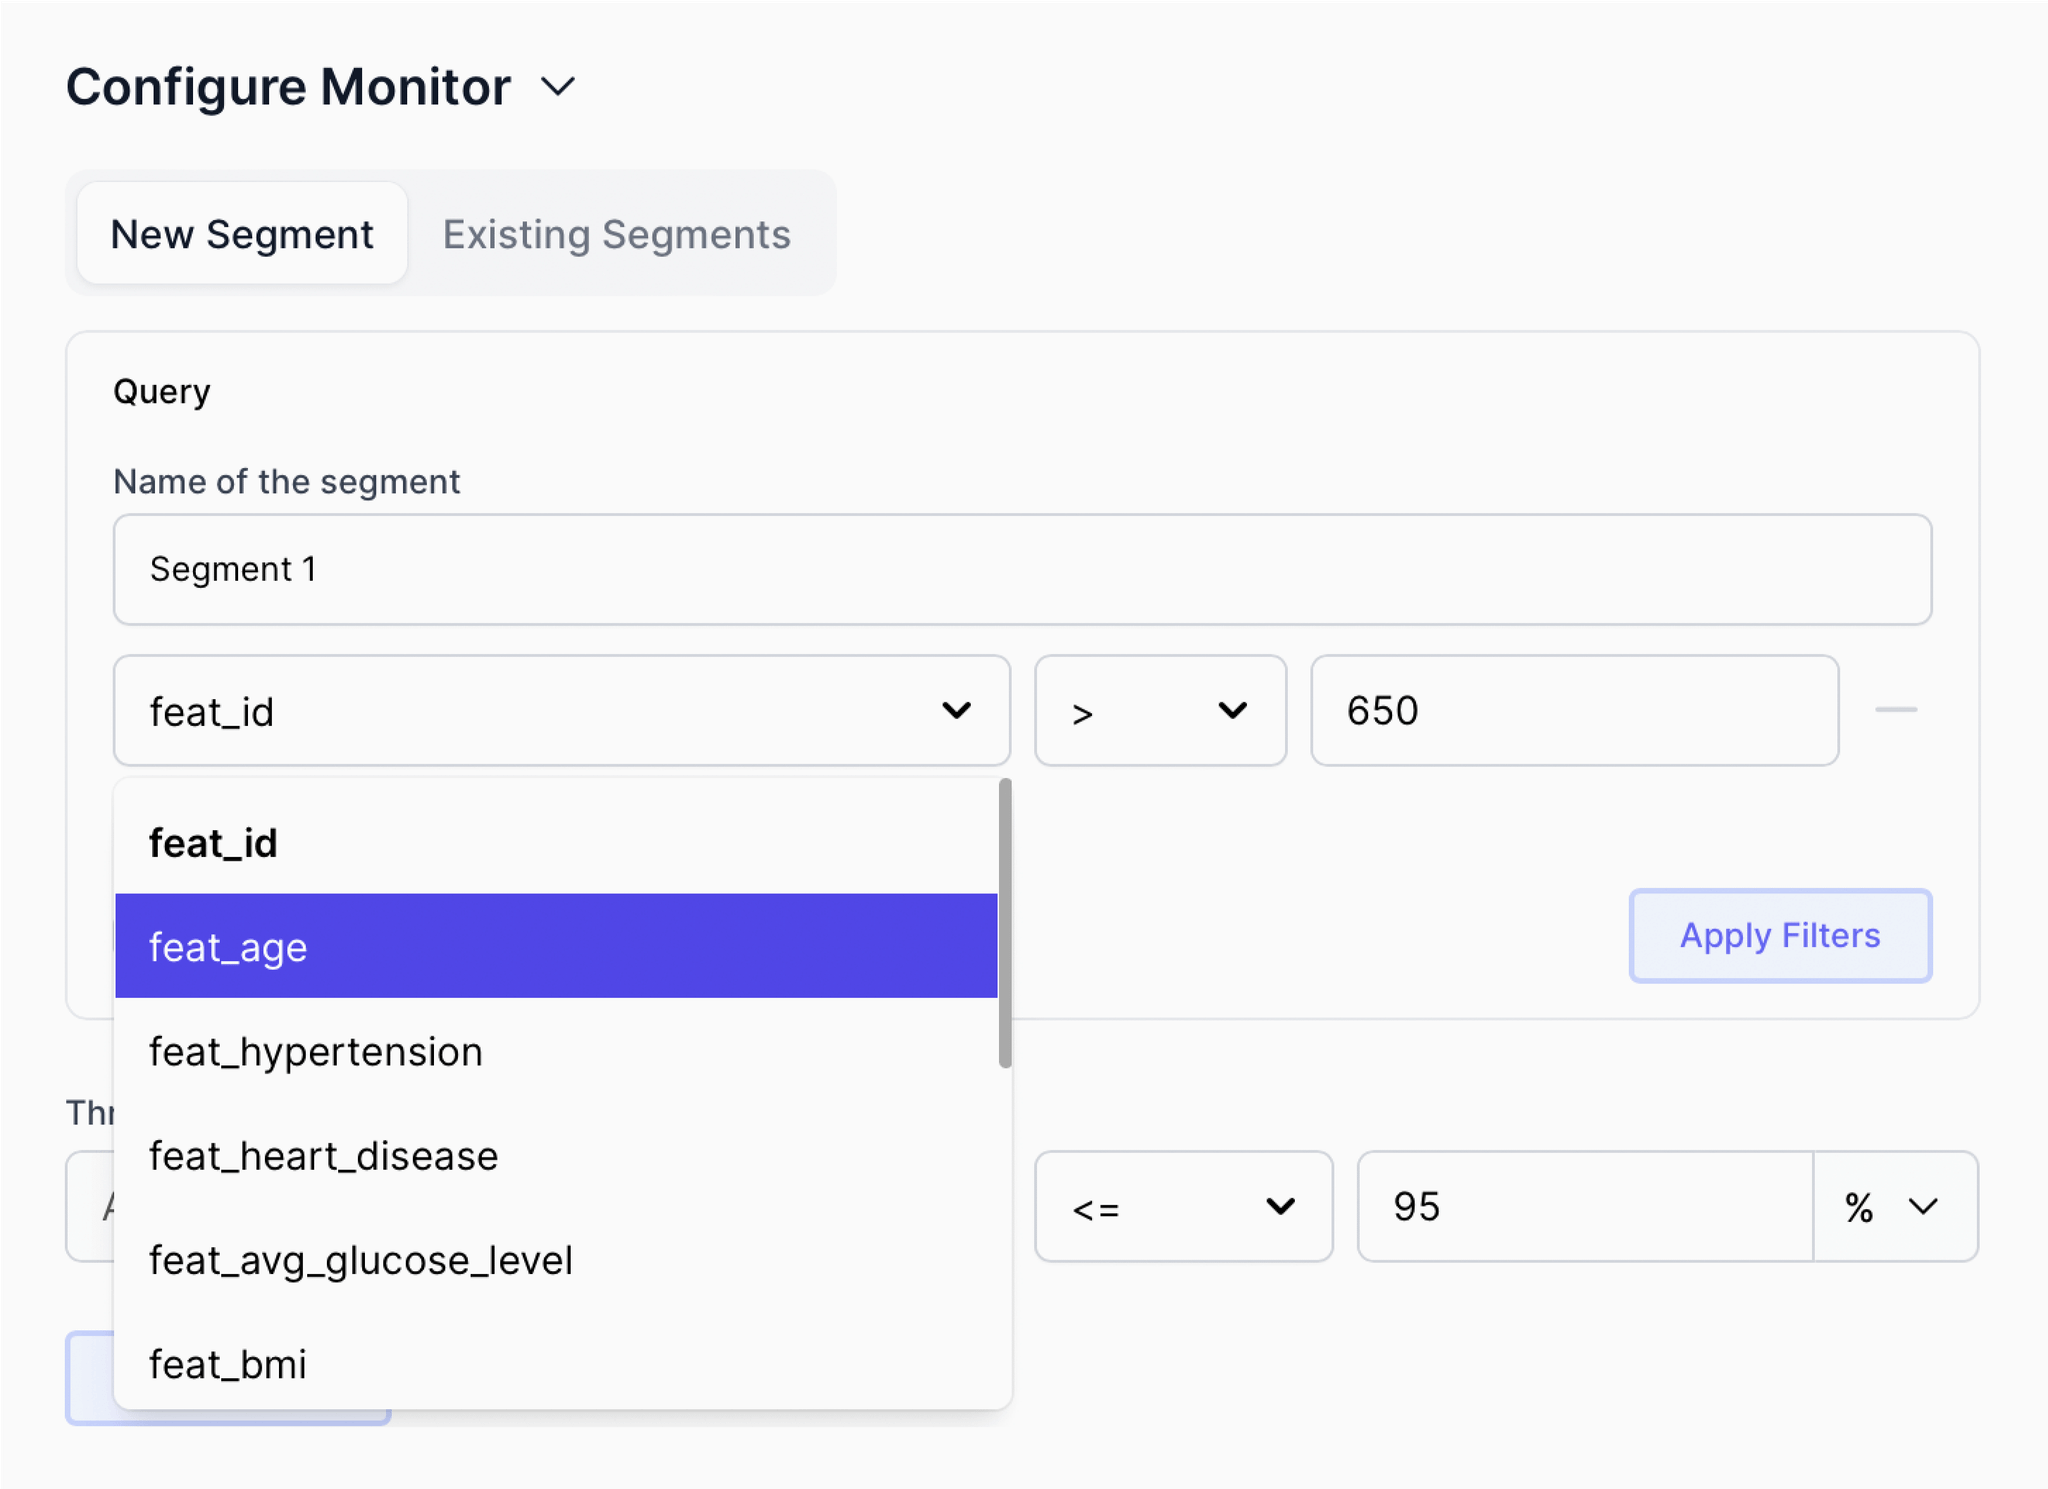
- Once you are satisfied with the data segment conditions, click on Apply Filters to create the New Segment
- If you wish to use a previously created data segment, simply click on the Existing Segments tab and select the required data segment

- After creating a new segment or selecting an existing one, you can set up the threshold value and conditions for specific features in the data segment
📘 The Threshold is a limit to gauge irregularities in the expected data behavior and performance.
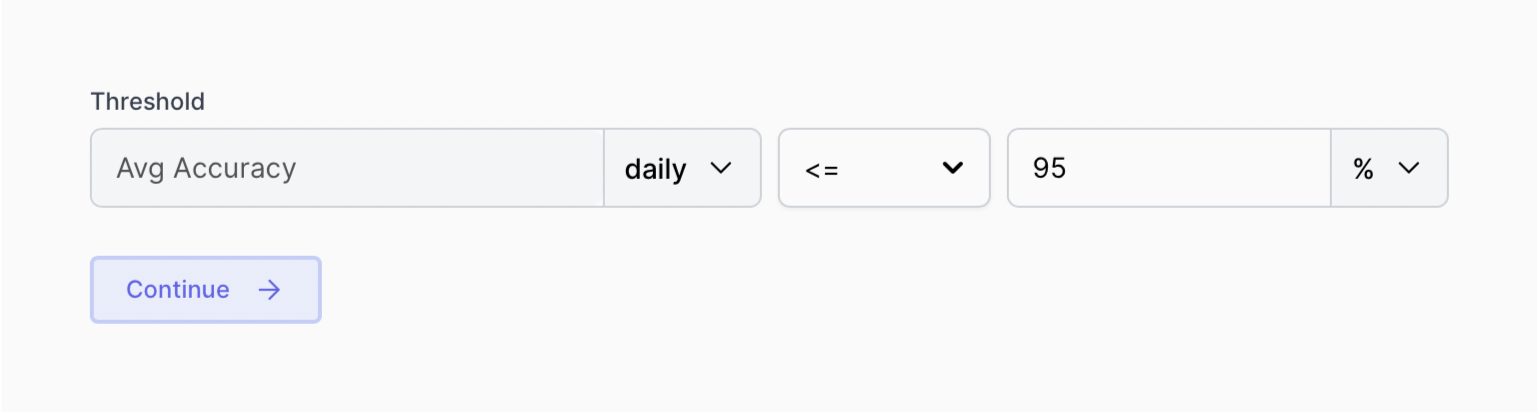
Click on Continue. The monitor will trigger a violation every time a data point in the selected segment crosses the threshold value.
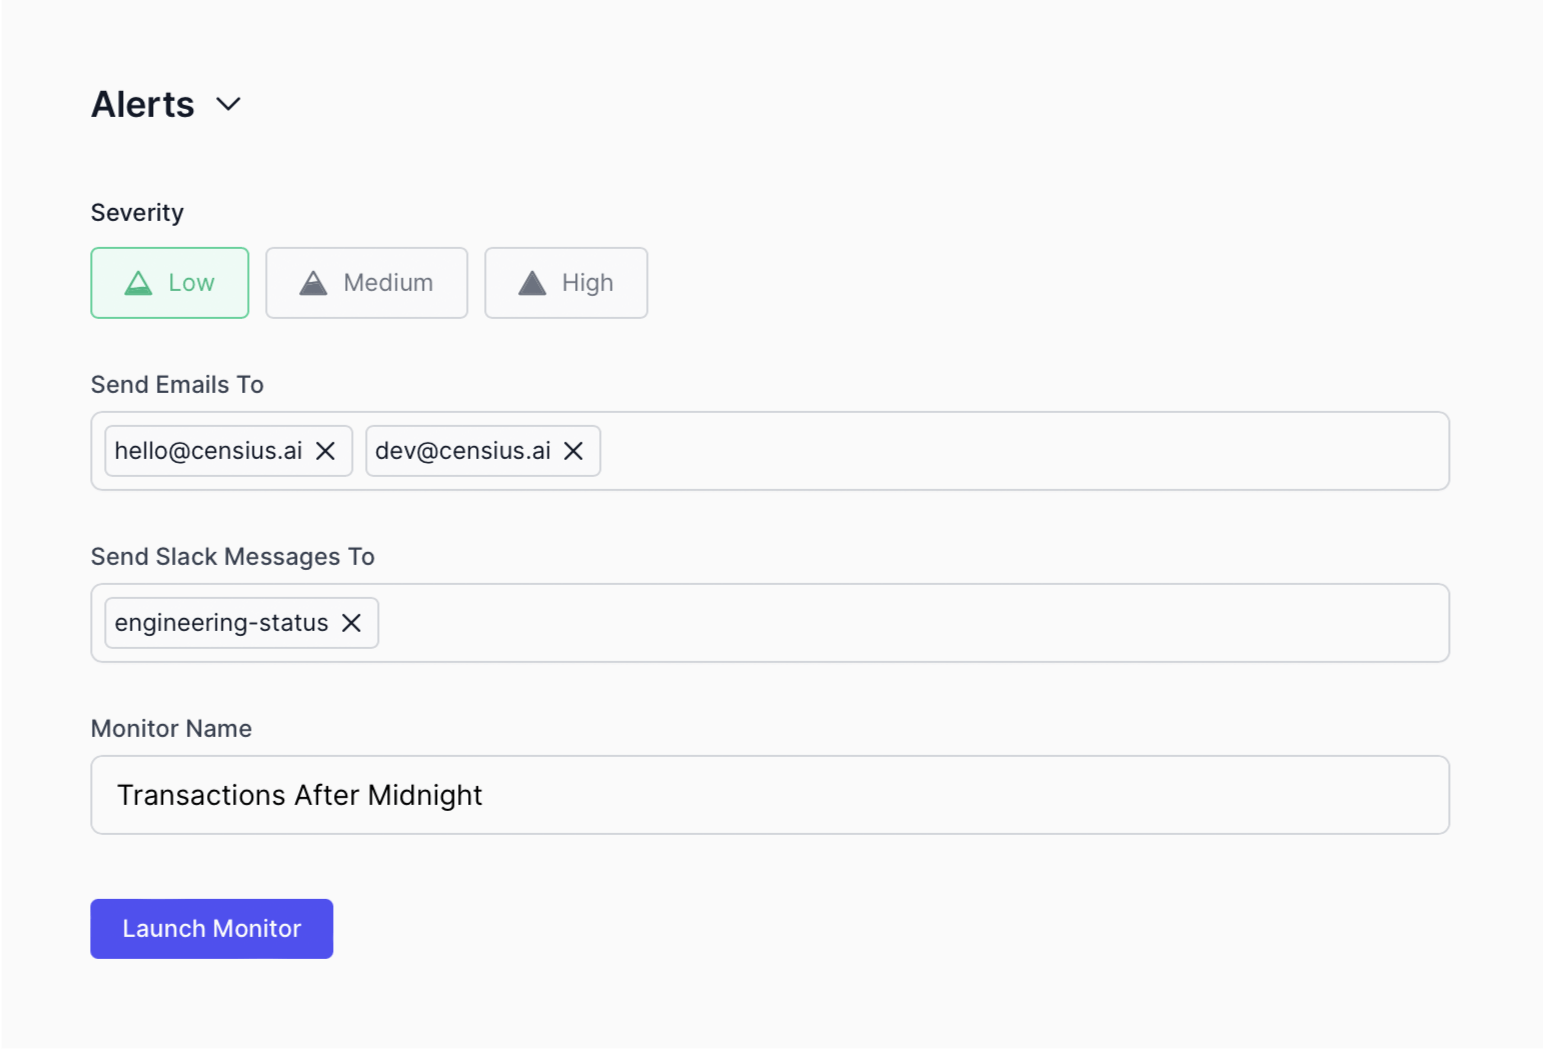
⚠️ Set Alerts
On clicking continue, you will be led to the Alerts section where you can customize the alert type for the threshold violation.
- Assign severity to the monitor violation ('Low', 'Medium', or 'High')
- Add the email IDs or slack channels of all the teammates who should be notified in case of any violation. Add or remove any number of email IDs or slack channels. Details sent in the alert include:
- Severity type
- Monitor name
- Violation condition
- Name the monitor
- Launch!
Once launched, the monitor will start running at the next scheduled time and track the configured data segment.
✂️ Editing Existing Monitors
Once your monitor is up, you can edit and customize it to great detail through the editing option available in the top-right corner of the
Monitoring Details section.
On clicking the edit button, you will have access to customize the monitor and alerts.
Once the editing window is open, the same process can be followed across type selection, segment configuration, and alert customization. The details will be pre-configured based on how the monitor was initially set up.
Once you are happy with the monitor including feature values for the data segment range, threshold condition, and alert severity, you can click on
Update Monitor.