The first few monitors are auto-initialized by Censius on the overall solution and the tracking starts immediately. However, to set up specific monitors with custom threshold values or data segments, custom monitoring options are also available.
🎨Types of Monitors Supported
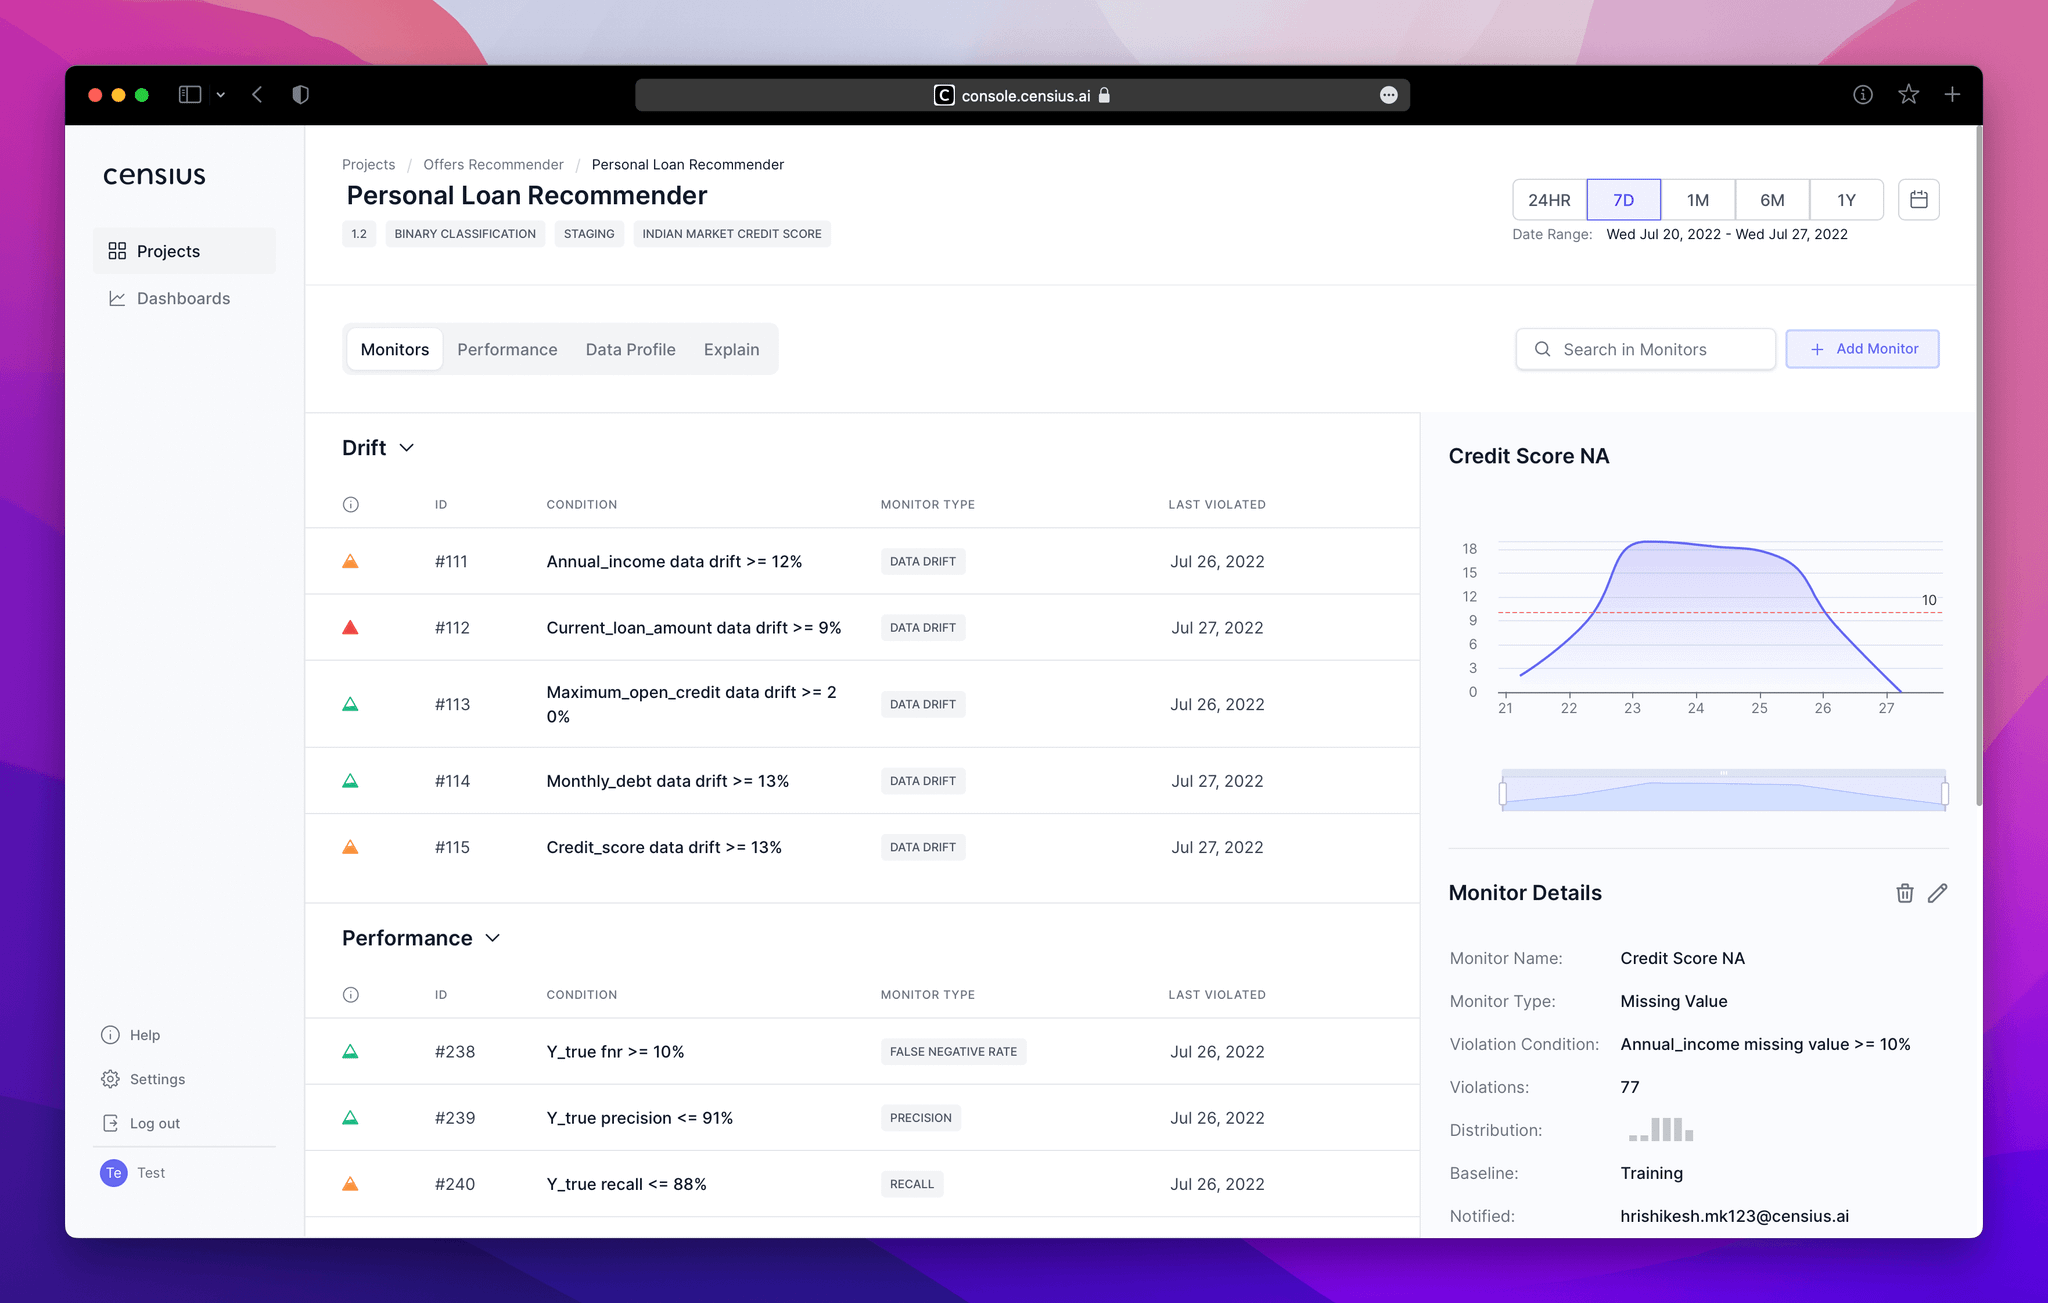
The Monitors tab enables you to view, analyze, and deep-dive into unlimited monitors and their related issues. There are three types of monitors you can manage through this tab:
- Performance monitors: Tracks performance dips through a wide range of performance metrics
- Drift monitors: Tracks data drifts and concept drifts
- Data quality monitors: Tracks data quality issues such as missing value, inconsistent data type, data ranges, and more.
- Activity monitors: Tracks and compares the volume of predictions and actuals
📄Monitoring Details
Details displayed on the table for each monitor include:
- Monitor ID
- Monitoring condition
- Monitor type
- Date of last violation
- Color code for violation severity
Additional details available on clicking any of the running monitors include:
- Interactive visual: To instantly detect the points of violation and get further details
- Violation count: The number of violations that have occurred within a selected date range
- Distribution: Interactive mini-visual of data distribution in the selected date range
- Baseline distribution: Distribution that the current data distribution is being compared with
- Person in charge: The primary teammate who will be notified in case of any violations
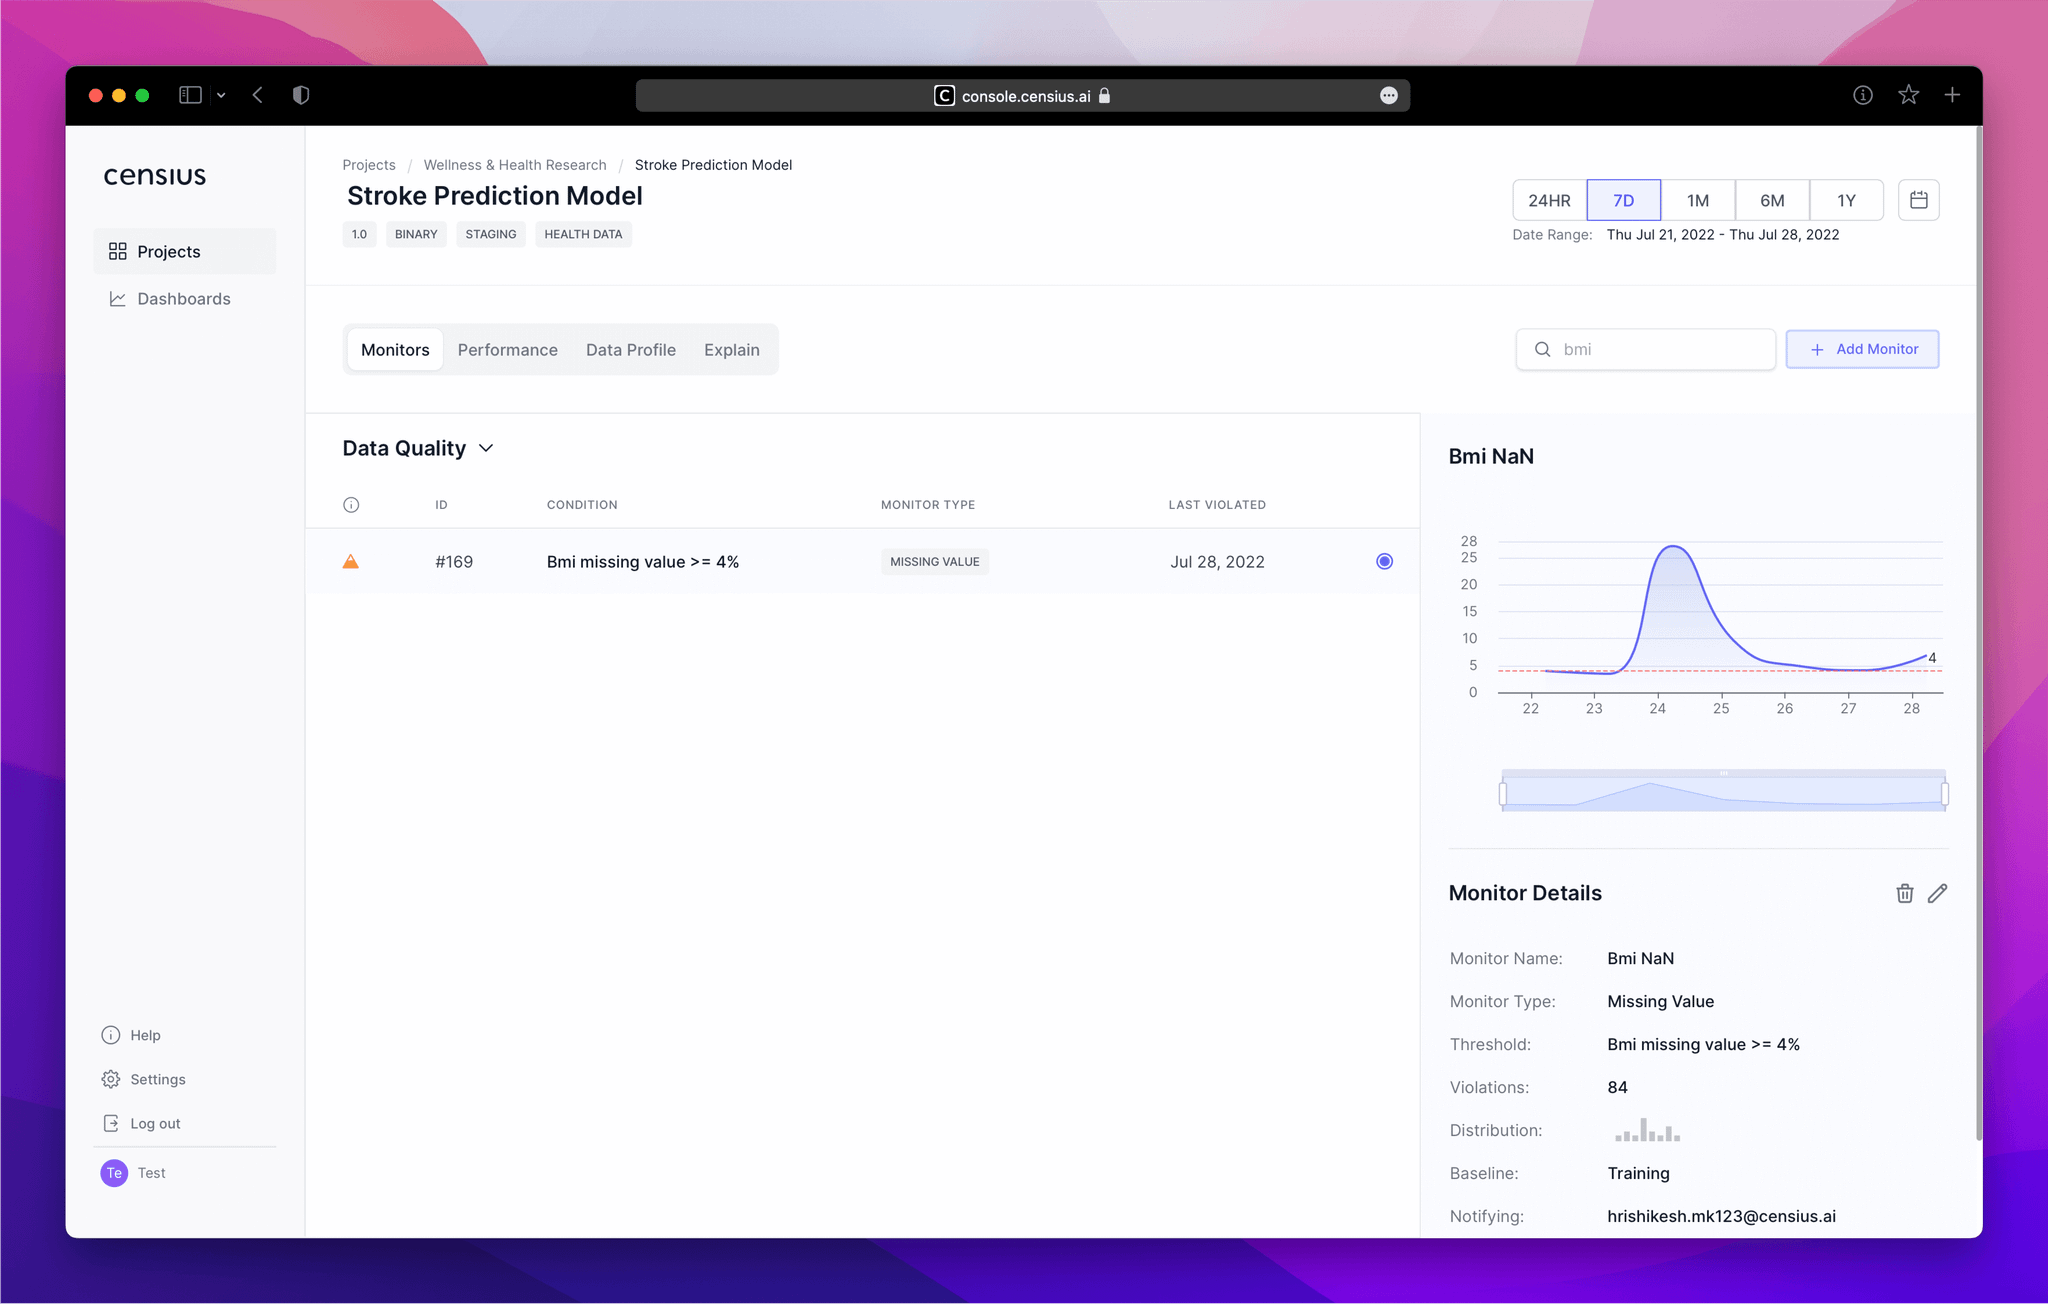
🔍Searching for a Monitor
The search function on the top-right corner allows you to instantly search for specific monitors and comes in handy especially when a project has multiple monitors running.
The search function is dynamic and the results start appearing as you type:
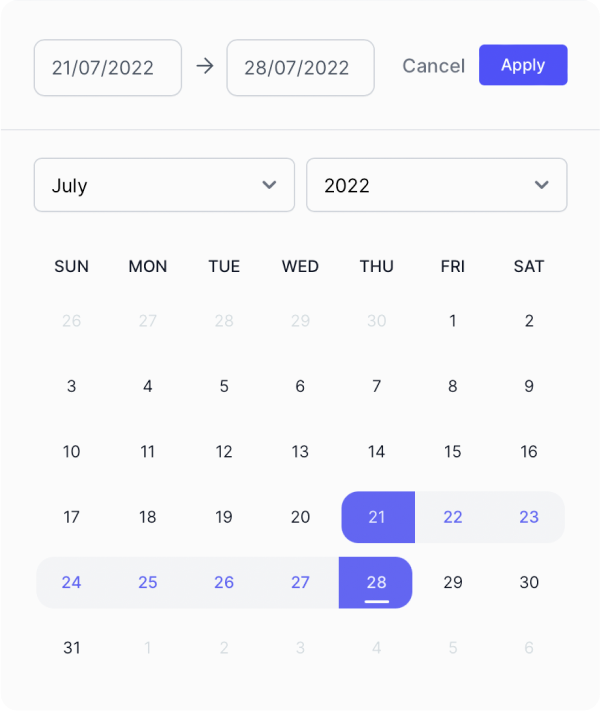
⏳Time Window
With the Monitors tab, you can quickly browse a specific historical time period to track and compare events without going back to code and writing queries every time.
On the top-left of this screen, you can easily switch between the Monitors, Performance, Data Profile, and Explain tabs.